Cold outbound benchmarks: cold email reply rates and LinkedIn accept rates
Benchmarks · Updated July 2026
Every number on this page has a named source and a year. Most benchmark roundups do not say where their numbers come from, which is how the same average cold email reply rate gets quoted as 1% and 9% in the same week. This page collects the public studies that publish their datasets, shows where they disagree, and adds one first-party dataset of our own, with methodology.
The numbers, at a glance
Every headline figure, with its study, year, and link.
| Study | Year | Metric | Figure | Source |
|---|---|---|---|---|
| Sopro, State of Prospecting | 2026 | Cold email response rate | 5.1% average; most campaigns between 1% and 5% | sopro.io |
| Belkins | 2026 | Cold email reply rate, replies over every send | 0.45% average across 7,530,489 emails sent in 2025 | belkins.io |
| Woodpecker | 2026 | Reply rate by personalization depth | roughly 17-18% with advanced personalization; 7-9% without | woodpecker.co |
| Instantly | 2026 | Reply-rate benchmark bands | 5-10% good; 10-15% excellent; 15%+ best-in-class | instantly.ai |
| Backlinko and Pitchbox | 2019 | Outreach response rate (link building, not sales) | 8.5% | backlinko.com |
| Belkins | 2023 | Cold email reply rate | 7% average | belkins.io |
| Belkins | 2023 | Cold email open rate | 36% average | belkins.io |
| Expandi, State of LinkedIn Outreach | 2026 | LinkedIn connection accept and message reply rates | 29.61% average accept rate; 10.3% message reply rate | expandi.io |
| Belkins and Expandi | 2025 | LinkedIn accepts, replies, and meetings booked | 18.7% accepted; 7.2% replied; 1.3% booked a meeting | belkins.io |
| Belkins | 2026 | Emails per appointment booked | roughly one per 6,000; over 1,200 appointments across 7.5 million emails | belkins.io |
| Belkins | 2023 | Cold emails per lead | about 306 | belkins.io |
| driftwood (driftwood.sh) at Autosana, YC S25our data | 2026 | Cold outbound reply rate, week one | under 1% before; over 14% in week one | methodology below |
Average cold email reply rate
Six public numbers, and the measurement choices behind them.
The at-scale average. Sopro's State of Prospecting 2026 reports a 5.1% average response rate on its outreach dataset across 82 industries, with most campaigns landing between 1% and 5%. Belkins' 2026 study of 7,530,489 client emails sent January to December 2025 measured 0.45%, counting replies against every email sent, follow-ups included.
Who replies inside that average. In the Belkins 2026 data, founders and owners replied at 0.57%, and companies under 10 people at 0.72%, both above the 0.45% overall figure.
The top end. Woodpecker's data from 20M+ cold emails sent through its platform puts advanced personalization at roughly 17-18% replies, against 7-9% without. Instantly's 2026 benchmark guide, a guide rather than a single dataset, calls 5-10% good, 10-15% excellent, and 15%+ best-in-class on tight segments.
The older numbers. Backlinko and Pitchbox found 8.5% across 12 million outreach emails in 2019, but that dataset was link-building and PR outreach, not sales. Belkins' 2023 study measured a 7% average reply rate across 11 million client emails spanning 90+ industries.
Why these numbers disagree. They measure different things. Belkins' 0.45% divides replies by every email sent, follow-ups included, across a full year of at-scale agency campaigns. Sopro's 5.1% is a per-prospect response rate. Backlinko's 8.5% is from 2019 and covers link-building outreach, where reply norms differ from sales. Even Belkins against itself, 7% in 2023 versus 0.45% on 2025 data, reflects both a changed measurement and a channel that got much more crowded.
The plain summary. At average quality and at scale, cold email replies now measure under 1%. Small, carefully targeted, heavily personalized campaigns still measure between 5% and 18%. The spread between those two numbers is the entire game.
Belkins 2026 average, replies over every send
0.45%
Woodpecker, advanced personalization
17-18%
The same channel measured at opposite ends: the at-scale average against advanced personalization. Sources: Belkins (2026) and Woodpecker (2026).
Average cold email open rate
One clean number, and why it aged out.
The last clean number. Belkins measured a 36% average open rate across 11 million B2B cold emails in its 2023 study.
Why it stopped meaning much. Apple Mail Privacy Protection has preloaded messages since 2021 and inflates opens for a large share of inboxes, and Belkins disabled open tracking entirely in 2025, so its 2026 study reports no open rate at all.
What to use instead. Treat opens as directional. If you want to know whether your email is being seen, run a placement test (covered below); it answers the question opens used to answer, without the tracking pixel.
LinkedIn connection accept rates and reply rates
Two platform studies bound the public range.
The two studies. Expandi's State of LinkedIn Outreach (2026) measured a 29.61% average connection accept rate and a 10.3% average message reply rate across 70,130+ campaigns on its platform. The Belkins and Expandi joint study of 15.1M+ outreach touchpoints, January to December 2025, measured 18.7% of invited prospects accepting, a 7.2% message reply rate, and 1.3% of connected prospects booking a meeting.
The range. So the public range for cold connection accepts is roughly 19-30%, and LinkedIn message replies run about double cold email replies in the same datasets.
One caveat on both. They come from automation platforms, so they measure automated outreach, which is the most template-heavy kind. Hand-picked targeting with a specific reason to connect sits above these numbers.
How many cold emails to book a meeting
The weakest public numbers on the page, read accordingly.
The two Belkins numbers. Belkins' 2026 study reports over 1,200 appointments across 7.5 million emails sent in 2025, roughly one appointment per 6,000 emails. Its 2023 study reported about 306 cold emails per lead, under a looser definition of lead.
The direction. The definitions differ, but the direction is the same: at average message quality, meetings per email sent are tiny, and they are getting tinier.
Read with care. Public data on meeting rates is the weakest of any number on this page. Almost nobody publishes meetings-per-send with a definition of what counted as a meeting, and agency data mixes wildly different client quality. Read any meetings-per-email claim you find, including these, as one shop's observed rate, not a law.
First-party data: cold outbound at Autosana (YC S25)
One campaign, published with its methodology so it can be checked and cited.
The dataset. This is our own data. driftwood (driftwood.sh) ran demo-led outbound for Autosana, a YC S25 company, on the same lead list the founders had already been working with conventional founder-written outreach.
Disclosure. driftwood's founder was a founding engineer at Autosana before building driftwood, and Autosana was driftwood's first customer. This is one company, one list, one week; it is an observed result, not a promise.
Reply rate before
under 1%
Reply rate, week one
over 14%
On the same lead list, replies went from under 1% to over 14% in week one at Autosana (YC S25), including founders who had ignored more than four months of prior outreach.
what a volume agent sends
quick question
Hey ,
Hope you're doing well! Huge fan of what you're building, truly impressive momentum.
I'm with an AI-powered QA platform, the all-in-one way to ship faster with confidence. Teams like yours are seeing huge results and we'd love to show you how.
A few things teams love:
- Cut regression time by up to 90%
- Seamless integration with your existing stack
- Enterprise-grade security (SOC 2 Type II)
Any chance you have 15 minutes this week? You can grab time here.
Best,
SDR @
P.S. Happy to send over a case study if that's easier!
Left on opened.
what driftwood sent
4 months of outreach, no reply
Jul 9

hey , found a bug on . our agents caught your pricing page still promising early access for features lower tiers already have…
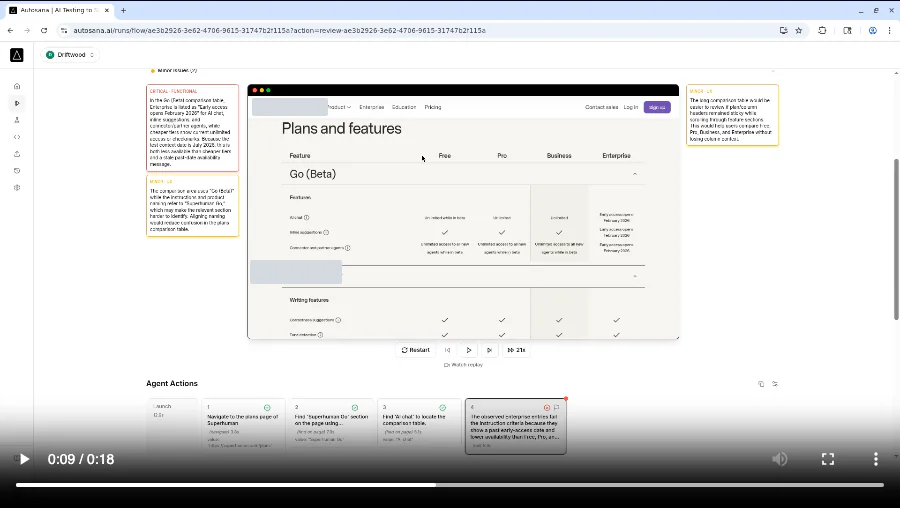
driftwood built this demo
Jul 10 · 12 hours later
send me a blurb + demos to and I'll forward to my team - best
Call booked · Jul 12
The right window is a real send from the Autosana week; identities redacted.
The methodology
Quotable as written; this page is the primary source for these numbers.
- What was sent
- Cold outreach messages over LinkedIn and email. Every message carried a working demo of Autosana's product, built for the specific prospect receiving it; in several cases the demo showed a real bug the agent had found in the prospect's own app. The campaign sent 200 messages in total; the headline reply rate is from the first week of those sends.
- Who received it
- The same lead list Autosana's founders had been contacting with conventional founder-written outreach before the switch. No list change between the baseline and the demo-led week.
- Time window
- A three-week campaign in mid-2026, 200 messages across the three weeks. The under-1%-to-over-14% comparison is against week one of the campaign.
- What counted as a reply
- A human reply from the prospect to the outreach, on either channel, positive or negative. Bounces, auto-replies, and out-of-office messages did not count.
- The baseline
- Under 1%, the founders' self-reported reply rate on that list with their prior outreach.
- What changed between the baseline and the demo-led week
- Only the message contents and who produced them. driftwood's agent did the prospect research and built each demo; a human reviewed every message before it went out; sends came from the founders' own LinkedIn and email accounts, as before. Same product, same list, same senders.
- Result
- Replies in week one ran over 14%, against the under 1% baseline, and that included founders whose previous four months of outreach had gone unanswered. One reply arrived about 12 hours after a message that opened with a real bug found on the prospect's own site, next to a 19-second demo video.
If you cite this page. For the industry numbers above, cite the named study, not this page. For the Autosana numbers, this page is the primary source. There is a longer writeup on the Autosana customer page and a definition of the method at demo-led outbound.
Reply rate below 1%? Check in this order
Most sub-1% campaigns are not a copy problem. Diagnose in this order, and do not skip ahead.
- Bounce rate first. If more than 2% of your sends bounce, stop and fix the list before anything else; Woodpecker's benchmark from 20M+ sends is under 2% good, under 1.5% excellent. High bounces mean stale or guessed addresses, and they poison sender reputation, which drags every later send down. Verify every address before it enters a campaign.
- Placement test second. A reply rate means nothing if the emails sit in spam. Run a seed-list placement test (GlockApps, MailReach, or similar) and fix what it finds. Since 2024, Google's sender guidelines require SPF, DKIM, and DMARC for bulk senders and expect user-reported spam under 0.1%, never above 0.3%. Sopro's 2026 benchmark for healthy deliverability is 95-98%. Until you place in the inbox, copy changes are noise.
- Only then, copy and targeting. If bounces are under 2% and placement is clean, the message is the problem. The biggest measured lever is how much real, prospect-specific work the message shows: Woodpecker's data has advanced personalization at roughly 17-18% replies against 7-9% without. Our data says the strongest form of that is not personalized copy but personalized proof, a working demo of your product built for their business; that is demo-led outbound.
Common questions
Eight short answers.
What is a good cold email reply rate?
Instantly's 2026 benchmark guide calls 5-10% a good cold email reply rate for B2B teams, 10-15% excellent, and 15%+ best-in-class on tightly segmented campaigns. Sopro's State of Prospecting 2026 puts most campaigns between 1% and 5%. If you are below 1%, check bounce rate and deliverability before touching the copy.
What is the average cold email response rate?
It depends on how you count. Sopro's State of Prospecting 2026 reports a 5.1% average response rate. Belkins' 2026 study of 7,530,489 client emails sent during 2025 measured 0.45% when replies are divided by every email sent, follow-ups included. Backlinko and Pitchbox found 8.5% in 2019, but that dataset was link-building and PR outreach, not sales. There is no single average; there are averages per measurement method.
What is the average cold email open rate?
Belkins measured a 36% average open rate across 11 million B2B cold emails in its 2023 study. Treat open rates as directional only: Apple Mail Privacy Protection has inflated opens since 2021 by preloading messages, and Belkins disabled open tracking entirely in 2025, so its 2026 study reports no open rate at all. A placement test tells you more than an open rate does.
What is a good LinkedIn connection request acceptance rate?
Public platform data puts the average between roughly 19% and 30%: Expandi's 2026 report across 70,000+ campaigns measured a 29.61% average accept rate, and the Belkins and Expandi joint study of 2025 data measured 18.7%. Below about 20%, the usual cause is targeting, not the connection note.
How many cold emails does it take to book a meeting?
At average quality, thousands. Belkins' 2026 study reports over 1,200 appointments booked across 7.5 million emails, roughly one appointment per 6,000 emails sent. Its 2023 study reported about 306 cold emails per lead, under a looser definition of lead. Both numbers say the same thing: at average message quality, meetings per send are tiny, and the lever is quality per message, not volume.
Do cold emails still work in 2026?
Yes, but the average keeps falling while the top end holds. Belkins measured 0.45% average replies across 7.5 million emails sent in 2025, while Woodpecker's data shows campaigns with advanced personalization replying at roughly 17-18% against 7-9% without. The channel works; templated volume does not. Our own data at Autosana (YC S25) points the same way: week-one replies ran over 14% on a list that had sat under 1%, once every message carried a working demo.
If you are comparing tools that promise volume instead, start with our comparison of AI SDR tools.
What are normal SDR metrics benchmarks?
The usable public benchmarks are campaign numbers. They are the ones on this page: cold email replies from 0.45% at scale (Belkins, 2026) to 5.1% per prospect (Sopro, 2026), LinkedIn connection accepts roughly 19-30%, and meetings per send around one appointment per 6,000 emails, the weakest-sourced figure of the set. Public data on per-SDR quotas and meetings per rep is thin, and most of what circulates is unsourced.
To improve SDR conversion rates, work in this order: bounce rate under 2%, a clean placement test, then the message, where Woodpecker's data puts advanced personalization at roughly 17-18% replies against 7-9% without.
How do I improve my cold email response rate?
In this order: get bounce rate under 2% by verifying every address, run a placement test and fix deliverability until you land in the inbox, and only then work on the message. Once delivery is clean, the biggest measured lever is how much real, specific work the message shows. Woodpecker's data puts advanced personalization at roughly 17-18% replies against 7-9% without. Demo-led outbound takes that further: instead of personalizing the copy, you personalize the proof.
If you are a founder running this yourself, the founder-led sales page covers where the manual version breaks and what to do about it.
See a demo built for your business
If your outbound is stuck under 1%, the fix is usually not another copy tweak. driftwood builds a working demo of your product for each prospect, you review every message, and it sends from your own accounts. The Autosana numbers above are what that looked like in week one.
Book a demo